How to implement a time control using Canvas
Recently, during a sharing session, we discussed our time travel widget. Following the session, many colleagues expressed their interest in learning about the widget's development process through GitHub Issues. I took the opportunity this weekend to rewrite this widget as a standalone Demo to share the technical implementation details with everyone.
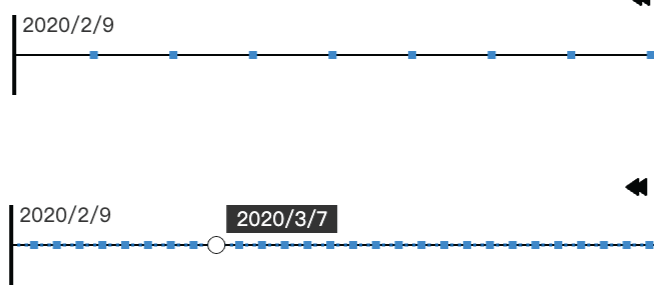
The reorganized widget is open-sourced on GitHub at https://github.com/zmofei/timeplayer. Everyone is welcome to raise issues or suggestions on the code for discussion and mutual progress. This article will also explain the implementation details in conjunction with the code. As shown in the figure above, the widget is divided into two parts: a top-end playback control module and a bottom time scale module. Due to space limitations, we will first introduce the scales implemented through Canvas. The content is highly related to the code, so it's recommended to read the article in conjunction with the code.
1. Initializing Canvas and handling high-definition screens
Before drawing any graphics with Canvas, we need to correctly initialize the Canvas. In the code /src/timeplayer.ts at line L133, we create and place a Canvas using the setupCanvas() method, also obtaining the Canvas context ctx. The above process is relatively simple, but let's focus on the code for adapting Canvas to high-definition screens at L144-L148:
// scale canvas
var dpr = window.devicePixelRatio || 1;
canvas.width = width * dpr;
canvas.height = height * dpr;
ctx.scale(dpr, dpr);
We used Window.devicePixelRatio to get the screen's pixel size ratio. Pixel ratio can be understood as how many physical pixels correspond to one PX pixel. We'll explain this with an image:
![]()
Assuming that in a devicePixelRatio of 1, one px corresponds to one physical pixel, then at this ratio, a 10px * 10px size will precisely have 10 * 10 physical pixels, and a 10px * 10px image can be evenly distributed to all physical pixels, so the image looks fine. But when devicePixelRatio is 2, things change. In such high-definition screens, the 10px * 10px area contains 20 * 20 physical pixels, meaning every four physical pixels (2 * 2) represent 1px, making the same 10px * 10px image if rendered in a higher clarity method (1px corresponds to one physical pixel), the output image size will become a quarter of its original size. To ensure the output image size remains unchanged when rendered, we must enlarge the original image by four times, then render each 1px split into using four physical pixels. We know that enlarging non-vector images results in quality loss, so without special processing, the same canvas image will appear blurred on high-definition screens.
Knowing why blurring occurs, we can prepare a "larger" canvas for drawing ahead of time. Since our actual canvas drawing content is based on "vector" coordinates, for high-definition screens, we only need to enlarge the Canvas size according to the pixel ratio during initialization, then scale our content accordingly, resolving the issue.
So, returning to our code, we first obtain the screen's pixel ratio devicePixelRatio, and then we enlarge the size of the Canvas according to this pixel ratio (note that at this time we are enlarging the Canvas's width and height, but the CSS size of the Canvas, i.e., the style's width and height, remains unchanged). After this operation, a Canvas of CSS size 10px * 10px will be enlarged to 20px * 20px, solving the blurring issue. However, this brings up another problem, such as when we want to draw a point at 5px * 5px, due to the canvas being enlarged, this point's location becomes 10px * 10px. To avoid this coordinate conversion work, we use the CanvasRenderingContext2D.scale() method to proportionally enlarge the canvas's context. This way, we do not need to reprocess the coordinates during drawing and can directly draw using the original values.
With the canvas preparation work completed, we can officially start!
Drawing Basic Process and Technical Details
The drawing process is placed in the draw() method. This method completes the main drawing process, starting with 1. clearing the screen content -> 2. drawing the scale -> 3. drawing the hover/selected dates. It is triggered at the appropriate times (usually when the drawing content changes, such as date change, mouse movement on the widget, etc.), and each time it follows the aforementioned process sequentially.
Canvas Technical Details Used:
As mentioned earlier in the process, we mainly performed the following three types of drawings:
* Drawing the ruler: drawScale()
* Drawing the hover state: drawHover()
* Drawing the selected state: drawActive()
Combining the code, you can see that some of Canvas's API interfaces were used in the drawing process, here is a simple explanation of the main methods used:
1. Drawing Lines
In Canvas, if you need to draw lines, you can achieve it through the following process:
- Start the path:
ctx.beginPath(), this method is used to create a new drawing path. - Set the path:
ctx.moveTo()ctx.lineTo(), where themoveTomethod is used to move the starting point of the subpath, and thelineTomethod connects this point to the last point in the path, which can be understood with the following image: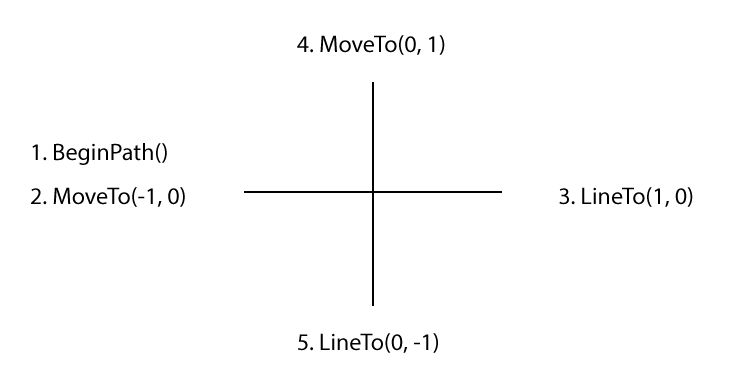 This image shows the process of drawing a cross-shaped line, try to understand what happened in steps 1-5, especially pay attention to understanding the use of the
 MoveTo()method between 3 and 4. - Setting the line width:
ctx.lineWidth() - Drawing lines/stroking:
ctx.stroke()None of the above methods will leave any trace on the canvas until we call the drawing-related methods likectx.stroke(),ctx.fill(), etc., which will finally render on the canvas.
A typical example code is as follows:
javascript
// ctx is the canvas context object
ctx.beginPath();
ctx.moveTo(100, 20);
ctx.lineTo(100, 100);
ctx.lineWidth = 1;
ctx.strokeStyle = 'red';
ctx.stroke();
2. Drawing Rectangles
The method for drawing rectangle points is very straightforward, mainly through fillRect(). Before drawing, the style of the rectangle to be drawn can be adjusted through the fillStyle property, as follows:
ctx.fillStyle = "green";
ctx.fillRect(10, 10, 100, 100);
This will draw a green rectangle of 100px * 100px at the coordinates [10,10].
If only the rectangle's border needs to be drawn (not filled), it can be done through strokeRect(). Similarly, before drawing, the border color can be adjusted through strokeStyle, and the line width can be configured through lineWidth, etc.
The process of drawing points is relatively easy, requiring only the calculation of coordinates based on the number of date points. However, in actual drawing, we must consider that if the number of dates is too large, all the points will be densely clustered together, which is not user-friendly. Therefore, in the design, we defined a minimum point spacing (10px, which users can adjust according to their needs). When the coordinate points are smaller than this range, we represent the nodes with smaller points to make the overall appearance more aesthetic.
The specific implementation can be seen in the code lines L233-L260. The for loop retrieves all date points and draws each calculated date point as small dots on the canvas. Additionally, it accumulates the spacing between points with each drawing. When the distance exceeds a certain value, the next point is recorded in the bigPoints array (i.e., the larger nodes we see), and after the small points are drawn, the larger nodes are iteratively drawn separately.
3. Drawing Circles
To draw the circle hover and selected areas appearing in the tool, it can be achieved by drawing circular arcs:
* arc(): For drawing circular arc paths. Since we need to draw a whole circle, the starting angles can be fixed from 0° to 360°, i.e., [0, 2 * Math.PI]. An example is as follows:
ctx.arc(75, 75, 50, 0, 2 * Math.PI);
ctx.fill();
This example draws a circle with a radius of 50 at the coordinates [75, 75] (0, 2 * Math.PI are the parameters mentioned above for starting angles).
Since the arc() method is a path-level operation, merely executing the arc() method will not leave any trace on the canvas. We need to set up the path first and control the fill color and stroke style through the fillStyle and strokeStyle properties. Then, we can color and stroke it using the fill() and stroke() methods.
The complete steps for drawing a circle can be seen in the code at L267-L273 and L305-L312.
4. Drawing Text and Text Backgrounds
Canvas makes it convenient to draw text, with the simplest method being the direct use of the fillText() method. When drawing text on both sides, we can facilitate coordinate calculation by setting ctx.textAlign = 'right' or ctx.textAlign = 'left'. The specific code can be seen at L277-L297.
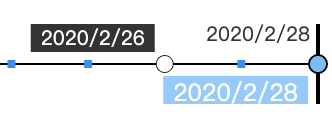
Regarding text backgrounds, since the length of the text displayed changes with the content, we need to obtain the text width before drawing. Here, we use the measureText() method to get this value. Then, by combining the method of drawing polygons previously used, fillRect, we can easily draw the background.
5. Determining Selection/Hover States
Finally, let's discuss how to implement mouse selection and hovering. Unlike DOM where we can simply bind hover or click events to each object (time node), we can only bind events to the entire canvas. Then, by obtaining the mouse coordinates relative to the canvas, we calculate which node the mouse is hovering over/clicking on. After initializing the canvas, we bind these events with this.setupEvens(); at line L113 in the code.
Looking at the mousemove or onclick events (L157-L163), it's easy to see that we first get the mouse coordinates in the canvas through e.offsetX. Then, we calculate the percentage of the mouse coordinates relative to the total width, and use this percentage multiplied by the total number of times, rounding to get a value. This value is the index in the time array, and the corresponding time text is dates[index].
After being able to detect the user's mouse hover or click positions, we need to provide an interface for users to monitor or cancel date changes. Here, we use the on and off methods to place event callbacks into the this.events[type] array. Each time the date changes, the system will check whether there are any functions bound in this.events[type], and if so, they will be executed.
Summary
The above provides a simple description of the Canvas drawing process within the time widget. The drawing process is not difficult; it mainly involves the correct use of Canvas's various interfaces. You can look at the code in conjunction with this explanation. If you have any questions, please leave a message.